
Why Traditional Recession Signals Broke — and the Role of Liquidity Since 2020
For decades, investors relied on a familiar playbook:
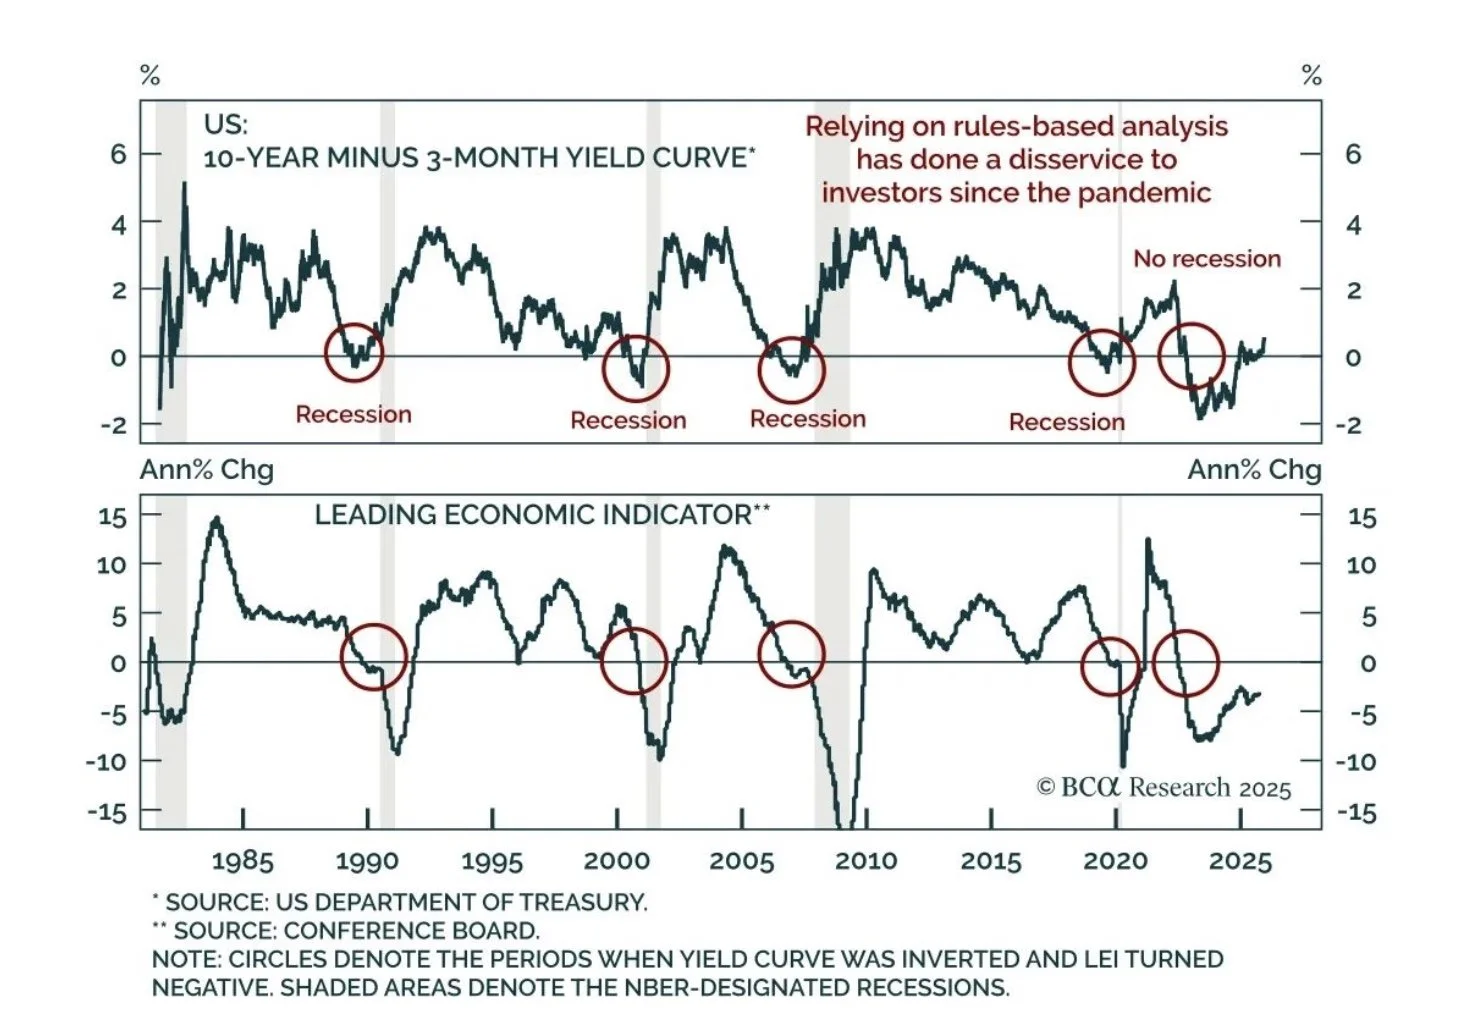
An inverted yield curve
A falling Leading Economic Index (LEI)
A recession shortly after
Historically, this framework worked remarkably well. The chart above illustrates that pattern clearly — yield curve inversions and negative LEI readings consistently preceded U.S. recessions for nearly forty years.
But since the pandemic, that relationship has fractured.
Despite one of the longest yield curve inversions on record and a deeply negative LEI, the U.S. economy has not entered a traditional recession. To understand why, we need to examine a variable that prior cycles didn’t contend with at this scale: extraordinary liquidity.
The Yield Curve: A Signal, Not a Cause
The yield curve reflects expectations about future growth and monetary policy. When short-term rates rise above long-term rates, it typically signals that financial conditions are tightening and growth may slow.
Before 2020, tighter conditions often meant:
Reduced bank lending
Higher borrowing costs
Less capital available to households and businesses
That transmission mechanism is what historically led from inversion → slowdown → recession.
However, the yield curve does not operate in isolation.
Liquidity Changed the Transmission Mechanism
Following the pandemic, the U.S. economy experienced an unprecedented wave of liquidity from both fiscal and monetary channels, including:
Large-scale fiscal stimulus
Direct household transfers
Expanded unemployment benefits
Corporate credit backstops
Bank reserve expansion
Emergency lending facilities
Balance sheet expansion by the Federal Reserve
This liquidity fundamentally altered how higher interest rates flowed through the economy.
Instead of capital becoming scarce:
Households entered the cycle with excess savings
Corporations refinanced debt at historically low rates
Banks remained well-capitalized
Credit continued flowing even as policy tightened
In other words, rates rose — but liquidity never truly left the system.
Why the Leading Economic Index Also Struggled
The LEI aggregates forward-looking indicators such as manufacturing orders, credit conditions, and financial market signals. In prior cycles, a sustained negative LEI almost always coincided with recession.
Yet post-2020:
Liquidity muted downside volatility
Labor markets remained unusually tight
Consumer balance sheets stayed resilient
Government spending offset private-sector slowing
The LEI correctly captured slowing momentum, but it overstated the probability of outright contraction because it could not fully account for policy-driven demand support.
Rules-Based Models vs. Policy-Driven Cycles
The key lesson from the chart is not that economic indicators are useless — it’s that rules-based analysis struggles in policy-dominated environments.
When:
Central banks actively manage liquidity
Governments deploy fiscal tools counter-cyclically
Markets anticipate intervention
Traditional cause-and-effect relationships weaken.
This does not eliminate cycles, but it changes their shape:
More rolling slowdowns
Fewer deep contractions
Longer transitions between regimes
Higher dispersion across sectors
What This Means for Investors
Relying solely on historical recession signals can lead to costly decisions, particularly when liquidity conditions override traditional constraints.
A more adaptive framework focuses on:
Liquidity flows, not just interest rates
Balance sheet health of consumers and corporations
Credit availability, not only credit cost
Fiscal policy alongside monetary policy
In modern markets, liquidity is often the binding constraint — not rates alone.
Bottom Line
The yield curve and LEI remain valuable tools, but they are no longer sufficient on their own. Since the pandemic, aggressive central bank and government intervention has reshaped economic outcomes, delaying or softening downturns that traditional models would have predicted.
Understanding why the signals failed is more important than dismissing them entirely.
Markets evolve. Frameworks must evolve with them.
Disclosure:
This content is provided for informational and educational purposes only and does not constitute investment advice, a recommendation, or an offer or solicitation to buy or sell any security. The views expressed are as of the date of publication and are subject to change without notice. Past performance and historical relationships are not indicative of future results. All investing involves risk, including the possible loss of principal. This material does not take into account the specific financial circumstances, objectives, or needs of any individual investor. Investors should consult a qualified financial professional before making investment decisions.